Control Charting is more than just finding values beyond the control limits.
The goal of control charting is to find individual or groups of data that cannot be explained as the result of normal process variation. There are many criteria that meet this definition of lack of process control:
- Any single point outside the control limits
- 2 out of 3 points outside the 2 Standard Deviation limits
- An increasing or decreasing trend of 10 consecutive points
- An up / down alternation of 20 consecutive points
- 10 consecutive points all either above or below the center line
Any control charting program that doesn’t catch all these anomalies is missing potentially useful information.
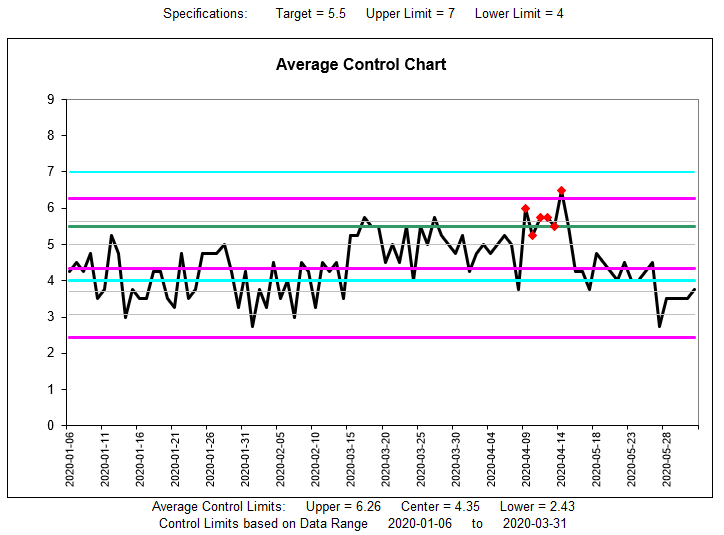
The Control Charts program also implements the ability to track both out-of-control and out-of-spec values on the same chart
- Out-of-Control identifies values that are statistically unusual for the process being measured
- Out-of-Spec values are outside the tolerances of acceptable production
Both these situations are critical to identify and remedy.
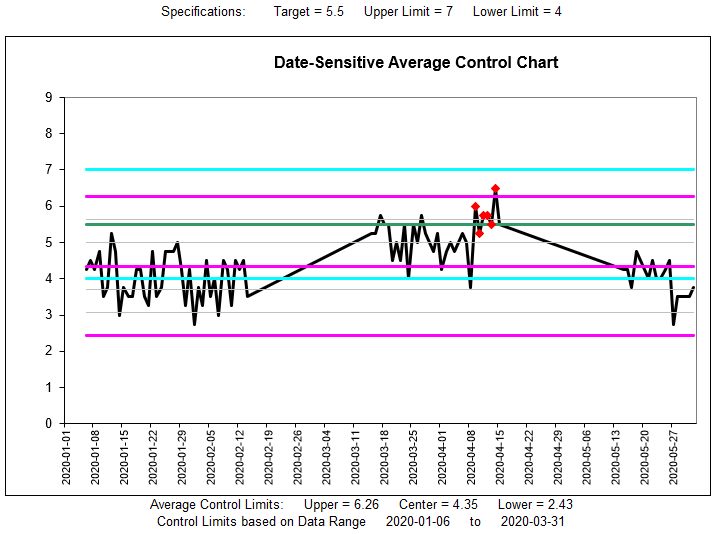
The program also displays the data in both “even spacing” and “date-sensitive” manner. Typical control charting programs show the data points spaced evenly along the X-axis. But making the X-axis date-sensitive helps highlight the seasonality or the impacts of factory shutdowns and start-ups.