Inter-Lab Collaborative Studies are used to determine whether all the laboratories participating in the study get similar results to each other when testing equivalent samples.
For example, 10 labs are asked to test a series of 8 samples, with each lab testing multiple replicates of each sample. The sample “levels” vary from low to high in a particular characteristic (could be weight or light intensity or chemical concentration – any quantifiable analysis).
This Study enables us to determine:
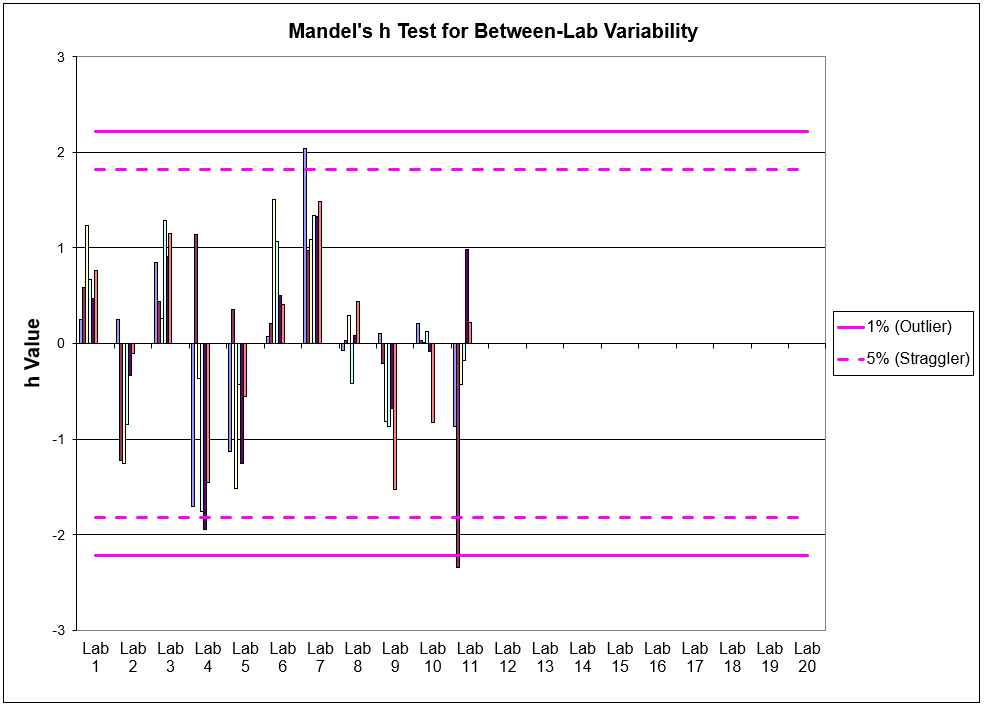
- Mandel’s h Test for Between Lab Variability
- Are the sample means measured by one lab significantly different than those measured by the other labs (do all the labs get the same results for each of the samples)
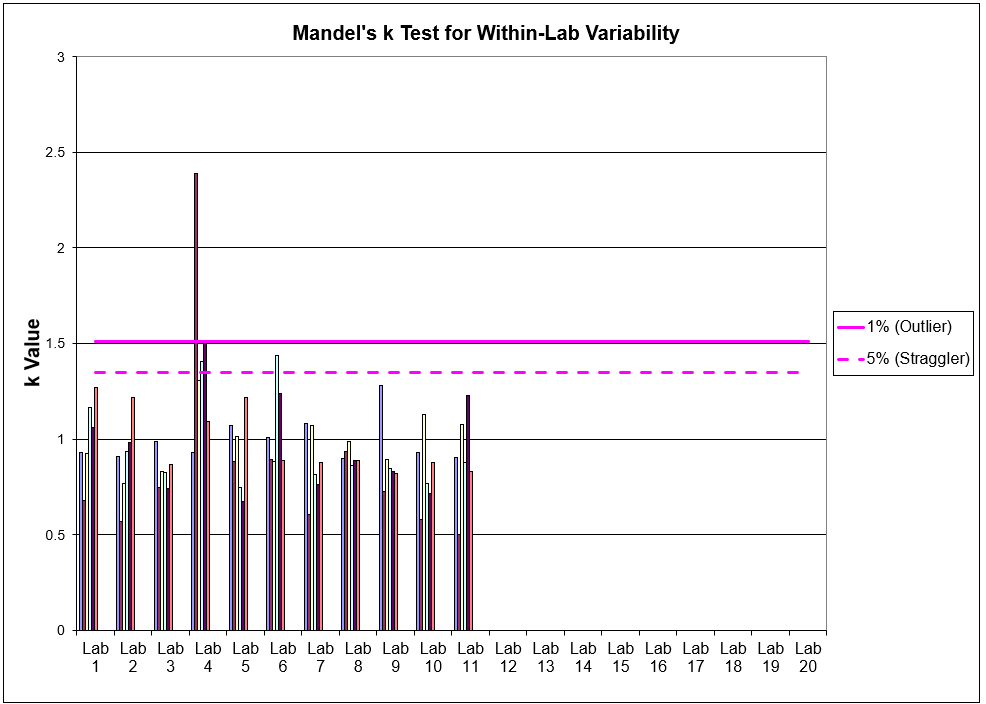
- Mandel’s k Test for Within-Lab Variability
- Does one lab have significantly higher variability in test results than the other labs
- Cochran’s C Test for Labs with High Variance
- Which lab had the highest degree of variability for each of the samples – and was the variability in that sample significantly higher than the variabilities of the other samples
The Inter-Lab Collaborative template enables the easy analysis of Studies designed with:
- Up to 20 labs
- On each of up to 20 samples (“levels”)
- Testing up to 20 replicates per sample
Just enter the test results to automatically generate charts for all of these statistical analyses. The charts clearly show all the results along with both the 5% (Straggler) and 1% (Outlier) thresholds.
Example of Inter-Lab Collaborative Charts (Mandel’s h Test, Mandel’s k Test, Cochran’s C Test)
(11 Labs testing 12 Replicates of 6 Samples):